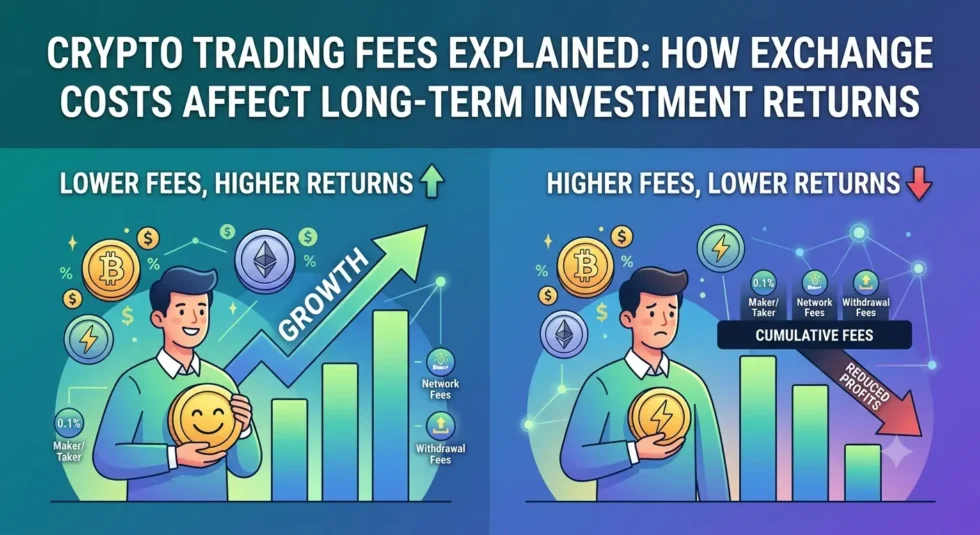
Crypto Trading Fees Explained: How Exchange Costs Affect Long-Term Investment Returns
A 0.5% difference in trading fees looks trivial on a single trade. On a £1,000 purchase, that’s £5 — easy to dismiss. But fees are not a one-time cost. They apply every time an investor buys, sells, converts or withdraws, and across dozens or hundreds of transactions over several years, that “trivial” difference compounds into a material drag on total returns.
This guide breaks down every layer of cost that affects a crypto trade — not just the advertised commission — and shows how each one erodes returns over time. For a platform-by-platform fee comparison across twelve major exchanges, see our Global Crypto Exchange Cost Map 2026, which this article builds on.
About the Author
Cristopher Hymon is a financial markets analyst specialising in digital assets, trading infrastructure, exchange cost structures and regulatory developments. His work focuses on how execution quality, hidden fees, liquidity mechanics and licensing regimes shape real-world outcomes for retail traders and investors.
The Real Cost Stack: What “Trading Fees” Actually Includes
Most investors think of exchange cost as a single number — the maker or taker fee shown on a pricing page. In practice, that published rate is only one of six layers that combine to determine the true cost of a trade.
| Cost Layer | What It Means | Typical Impact |
|---|---|---|
| Commission | The published maker/taker fee on the standard trading interface | Directly comparable across exchanges, but incomplete on its own |
| Spread | The gap between the best bid and best ask price | Paid silently on both entry and exit; widens during volatility |
| Simple/Instant-buy premium | The cost of using a homepage “Buy” button instead of the order book | Can run several times higher than the standard trading fee |
| Withdrawal / network fee | The flat fee charged to move assets off-exchange | Often exceeds the real blockchain cost; varies sharply by network |
| Conversion fee | The cost of converting between fiat currencies or asset pairs | Disproportionately affects GBP and EUR users on USD-denominated platforms |
| Funding fee | The periodic charge on leveraged perpetual futures positions | Invisible unless a position is held open; compounds over time |
A strategy or habit that looks profitable when only the first layer is counted can quietly become unprofitable once all six are included.
Why “0% Commission” Rarely Means 0% Cost
Several exchanges and simplified trading apps advertise low or “zero” commission on their default buy screens. This is one of the most common ways headline pricing misleads retail investors, because commission-free interfaces virtually always replace the visible fee with a spread instead.
Published comparisons of major exchanges’ simple-buy interfaces illustrate the pattern clearly: Coinbase’s Simple Trade screen has been cited at roughly a 1.5% spread plus fees up to 3.99% depending on payment method; Kraken’s Instant Buy at roughly a 1.5% spread plus a 0.9% processing fee; Gemini’s basic interface at a combined 1.49% transaction fee plus a 1.00% convenience fee. On every one of these platforms, the same exchange’s standard order-book or “advanced” interface charges a small fraction of that cost — commonly citied fee comparisons put the difference at five to twenty times more expensive on the simplified screen.
The practical rule: if an interface is described as “simple,” “instant” or the default homepage button, assume it carries a spread-based premium, even if no separate commission line is shown.
Worked Example: The Same Trade, Two Different Fee Structures
To show how this compounds, consider an investor depositing £500 into crypto twice a month for three years — 72 trades total — comparing a low-fee order-book platform against a simplified buy-screen habit.
| Scenario | Effective Cost per Trade | Total Trades | Total Cost Over 3 Years |
|---|---|---|---|
| Low-fee order-book platform (~0.10%–0.16%) | ~£0.50–£0.80 | 72 | ~£36–£58 |
| Simple/instant-buy interface (~1.5%–2.5% combined) | ~£7.50–£12.50 | 72 | ~£540–£900 |
This is a simplified illustration, not a prediction of any specific platform’s current pricing, and excludes withdrawal and conversion fees layered on top. But the direction of the gap is consistent across every published exchange fee comparison: the convenience of a one-tap buy button is one of the most expensive habits an investor can develop, and the cost is easy to miss because no single transaction feels large.
The Withdrawal-Fee Trap
Trading fees get the most attention, but withdrawal fees can be equally significant for investors who regularly move assets to self-custody wallets. Exchanges typically charge a flat withdrawal fee per asset — and that flat fee frequently exceeds the actual blockchain network cost, particularly during periods of low network congestion.
Network selection compounds this further. Withdrawing the same stablecoin can cost dramatically different amounts depending on which blockchain network is selected — published comparisons have cited a roughly fifteen-fold difference between withdrawing USDT via the TRC-20 (Tron) network versus the ERC-20 (Ethereum mainnet) network, for functionally the same asset reaching the same destination. Some exchanges, such as Coinbase, use dynamic withdrawal fees that adjust with network conditions rather than a fixed rate, which can be cheaper or more expensive depending on timing.
Practical takeaway: before withdrawing, always check which networks the destination wallet supports and select the lowest-cost compatible option — this single check can save the majority of a typical withdrawal fee.
Funding Fees: The Cost That Compounds Silently on Leveraged Positions
For traders using perpetual futures rather than spot trading, funding fees represent a cost layer that doesn’t appear anywhere near the trading fee schedule. Perpetual futures contracts use periodic funding payments between long and short position holders to keep the contract price aligned with the underlying spot market. Held over hours or days, these payments accumulate — and unlike a one-time trading fee, they scale with how long a position stays open, not just how large it is.
This matters more, not less, for cost-conscious investors: a trader who correctly predicts price direction can still see returns eroded by accumulated funding costs if a leveraged position is held longer than intended.
Conversion Fees: The Hidden Cost for GBP and EUR Investors
Many exchanges are priced and structured around USD as the base currency. For UK and European investors funding accounts in GBP or EUR, an additional conversion cost is often layered on top of standard trading fees — either as an explicit conversion fee or embedded in a less favourable exchange rate at the point of deposit or withdrawal. This is a cost category that a UK investor comparing two platforms’ USD-denominated trading fees can easily overlook, since it doesn’t appear in the headline maker/taker comparison at all.
How to Audit Your Own True Trading Cost
Investors can estimate their real effective cost with a short checklist:
- Identify which interface you actually use — order book / advanced trading, or the simple buy screen. These can differ in cost by a full order of magnitude on the same exchange.
- Check the current spread on your typical trade size and asset, not just the published commission.
- Total your deposit and withdrawal fees over the past 12 months, including network fees if applicable.
- Add any conversion cost if funding in GBP or EUR on a USD-denominated platform.
- For leveraged positions, total accumulated funding payments, not just the entry/exit trading fee.
- Multiply by trade frequency to see the annualised, not per-trade, cost — this is where the compounding effect becomes visible.
Why This Matters More for Long-Term Returns Than It Appears
Academic research on retail trading behaviour outside crypto markets reinforces this pattern. Barber and Odean’s study of 66,465 discount-broker households found that the most active traders earned an annual return of 11.4%, compared to a 17.9% market return over the same period — a gap the researchers attributed largely to the drag of excessive trading costs, not poor asset selection. Crypto markets add additional cost layers on top of standard brokerage fees — spread, network withdrawal costs and, for leveraged traders, funding fees — meaning the compounding effect of frequent trading is, if anything, more pronounced than in traditional equity markets.
Fee Comparison Snapshot Across Major Exchanges
| Platform | Base Spot Fee (Maker/Taker) | Simple/Instant-Buy Premium |
|---|---|---|
| Binance | ~0.10% / 0.10% | Convert screen carries added spread |
| Kraken | ~0.16% / 0.26% | Instant Buy: ~1.5% spread + 0.9% processing |
| Coinbase (Advanced) | ~0.40% / 0.60% | Simple Trade: spread + fees up to ~3.99% |
| Gemini | ActiveTrader tiered, ~0.20–0.40% | Basic: 1.49% + 1.00% convenience fee |
| KuCoin | ~0.10% / 0.10% | Simple buy screens cost more |
Full base-tier fees, withdrawal considerations and regulatory status for all twelve platforms in this comparison are detailed in The Global Crypto Exchange Cost Map 2026.
Frequently Asked Questions
Are crypto exchange fees tax-deductible in the UK?
Trading costs can generally be factored into the acquisition or disposal cost when calculating Capital Gains Tax, but this depends on individual circumstances. HMRC’s Cryptoassets Manual sets out how gains and losses are calculated on disposal, and investors with complex trading histories should consider professional tax advice.
Is a 0% commission platform ever actually free to use?
No published 0% commission crypto platform reviewed for this article was cost-free in practice — commission-free interfaces consistently replace the visible fee with a spread, which is harder to notice but not smaller.
How much does trade frequency actually matter for fees?
Significantly. A £5 fee on a single trade is immaterial; the same £5 fee repeated across 100 trades a year is £500, before any spread or withdrawal costs are added — this is the core reason frequency, not just per-trade cost, determines total fee drag.
Do withdrawal fees vary by which cryptocurrency I hold?
Yes, substantially, and the fee is set by the exchange rather than the underlying blockchain in most cases, meaning it can exceed the real network cost. Selecting the correct network can meaningfully reduce this.
Which matters more for long-term investors: trading fees or spread?
For long-term, infrequent traders, spread and simple-buy premiums usually matter more than the published commission, since most long-term investors use simplified buy screens rather than the advanced order book. For active traders, the published maker/taker commission dominates due to trade frequency.
Sources and References
- Barber & Odean — “Trading Is Hazardous to Your Wealth” (2000)
- HMRC Cryptoassets Manual — CRYPTO22100
- Publicly available exchange fee schedules and fee-comparison analyses: Binance, Coinbase, Kraken, Gemini, KuCoin (checked early-to-mid 2026; subject to change)
- Independent fee-comparison research: Spark (“Crypto Exchange Fee Comparison: Coinbase vs Kraken vs Binance”); Home Crypto Invest (“Crypto Exchange Fees Compared 2026”)
- This site’s pillar page: The Global Crypto Exchange Cost Map 2026