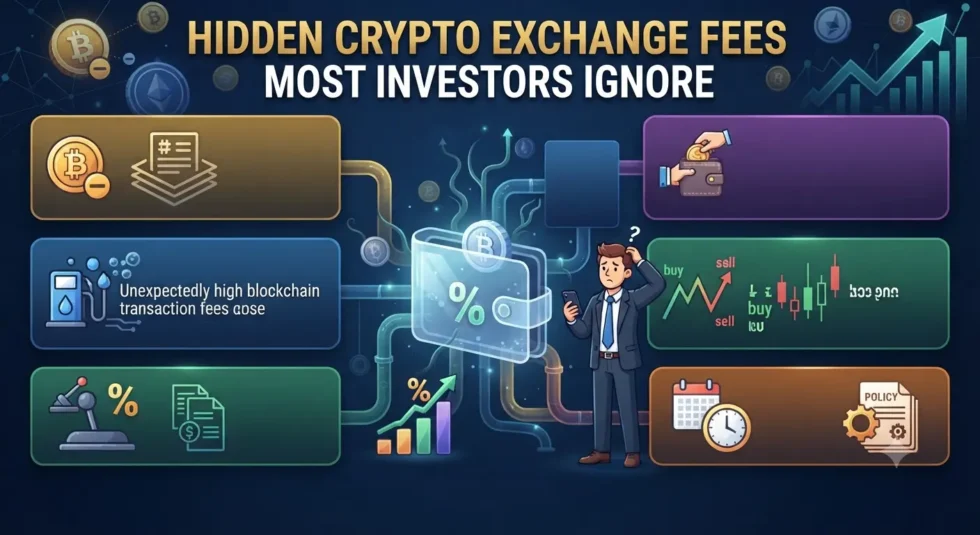
Hidden Crypto Exchange Fees Most Investors Ignore
Most investors compare exchanges on one number: the headline maker/taker rate. That number is real, but it’s rarely what actually shows up as the gap between what you paid and what you own. The bigger drag usually comes from the spread baked into “simple” buy screens, network-dependent withdrawal costs, payment-method surcharges, and staking commissions that never appear on a fee schedule at all.
This article breaks down where those hidden costs actually live, using each exchange’s own published fee data, current 2026 regulatory status, and documented security history — not generic “fees vary” disclaimers. It’s a companion piece to our Global Crypto Exchange Cost Map 2026, which ranks 12 platforms on fees, liquidity, security, withdrawal speed, and compliance, and it builds on the framework in Crypto Trading Fees Explained: How Exchange Costs Affect Long-Term Investment Returns, which shows how a fee difference of a few tenths of a percent compounds over years of investing.
The fee you see isn’t the fee you pay
Every major exchange advertises a low maker/taker rate on its “pro” or “advanced” trading interface. Binance quotes 0.10%/0.10% at the base tier, Kraken quotes 0.16% maker / 0.26% taker on standard pairs, and Coinbase Advanced Trade quotes a range roughly between 0% and 0.60% depending on 30-day volume. Those numbers are accurate — but almost nobody trades exclusively on the advanced interface, and the simplified “instant buy” screens most retail investors actually use carry a completely different, much higher cost structure.
Coinbase’s own fee disclosures confirm this directly: on simple buy, sell, and convert orders, the company builds a spread into the quoted price before any separate fee is applied, and that spread is not itemized as a line item — it’s embedded in the exchange rate you’re shown. Coinbase states this spread can vary for similar transactions and that it may retain any excess spread collected. Independent fee audits estimate this spread at roughly 0.5%, with total effective cost on the standard app running 1.5% to 4% once the payment-method fee is layered on top — compared to Advanced Trade’s 0% to 0.60% range. On a $1,000 purchase, that’s the difference between roughly $6–$8 in total cost and $15–$40, depending on how you pay.
This isn’t unique to Coinbase. The pattern holds across the industry: the advanced/pro interface uses transparent order-book pricing, while the default retail screen bundles a spread most users never see itemized:
- Coinbase Simple: roughly a 1.5% spread plus a payment fee that runs up to 3.99% on debit/credit card purchases
- Kraken Instant Buy: roughly a 1.5% spread plus a 0.9% processing fee, versus 0.16%/0.26% on Kraken Pro
- Gemini Basic: a 1.49% transaction fee stacked on a 1.00% convenience fee
- Binance Convert: spread-based pricing with no explicit fee displayed at all
Switching from the default screen to the exchange’s advanced trading view — available at no extra cost on every major platform — is the single highest-leverage move most investors can make. It routinely cuts total transaction cost by 60–90%.
Payment method is a bigger lever than most people realize
How you fund a trade often costs more than the trade itself. Coinbase’s published fee schedule shows debit and credit card purchases charged up to 3.99%, while ACH bank transfers in the US are free and SEPA transfers in the EU run about €0.15 flat. On a $1,000 purchase, that’s roughly $40 in card fees disappearing before you’ve made a single trading decision — money that has nothing to do with market timing or exchange selection and everything to do with which “Deposit” button you clicked. Binance and Kraken show the same pattern: SEPA and ACH are free or near-free, while bank-card withdrawals run 1–2% and wire transfers carry flat fees in the $5–$25 range depending on the exchange and currency.
Withdrawal fees: the cost that depends entirely on a dropdown menu
Network selection is where investors lose money without realizing it, because the fee for moving the exact same asset can differ by an order of magnitude depending on which blockchain you route it through. Withdrawing USDT provides the clearest example: Binance charges roughly $1 for a TRC-20 (Tron network) withdrawal versus up to $3.50–$15 for the same withdrawal on the ERC-20 (Ethereum) network — a 3x to 15x difference for identical tokens landing in the identical wallet. Kraken’s USDT withdrawal fees run a comparable $1–$2.50 depending on network choice.
Bitcoin and Ethereum withdrawals follow the same logic but with fixed, coin-denominated fees rather than percentages: Binance charges 0.0001–0.0005 BTC and 0.00028–0.005 ETH depending on network congestion, while Kraken’s flatter schedule runs closer to 0.00002 BTC and 0.0025 ETH. Coinbase instead passes through the actual on-chain gas fee at the time of withdrawal, which means the cost is invisible until you actually initiate the transfer and floats with network conditions.
The practical takeaway is mechanical, not strategic: before withdrawing a stablecoin or token that exists on multiple chains, check which network your destination wallet supports and choose the cheapest compatible option — usually TRC-20 or a low-fee chain like BNB Smart Chain for stablecoins. This single check can turn a $15 withdrawal into a $1 one.
Staking commissions: a hidden fee on your yield, not your trade
Staking rewards get marketed as “passive income,” but exchanges take a cut before you ever see a return, and that cut is rarely disclosed with the same prominence as trading fees. Coinbase’s staking commission runs 25% on Ethereum rewards and up to 35% on other supported assets. That means an advertised 4% staking yield is closer to 3% after the platform’s cut — a real, recurring cost that compounds the same way trading fees do, just on the yield side of the ledger instead of the transaction side.
Regulatory status is a cost input, not just a compliance checkbox
Regulatory standing determines which fee schedule, product range, and leverage limits actually apply to you, and 2026 has been the most consequential year yet for this because the EU’s Markets in Crypto-Assets regulation (MiCA) became fully enforceable on July 1, 2026. Any exchange without full Crypto-Asset Service Provider (CASP) authorization can no longer legally serve EU clients after that date, and roughly 280 firms held that authorization as of early July 2026, including Kraken (authorized via Luxembourg’s CSSF and Ireland’s Central Bank) and Coinbase (authorized via Luxembourg, operating its EU hub as Coinbase Europe).
Binance’s situation is the clearest illustration of why this matters for costs, not just legality. On June 24, 2026, Binance withdrew its MiCA license application with Greece’s Hellenic Capital Market Commission after 18 months in the process, just six days before the deadline, and as of that withdrawal it did not hold a valid CASP license in any EU member state. Reuters had reported the Greek regulator was set to reject the application outright. Binance stated it intends to pursue authorization in another member state and that it would take steps to remain compliant before July 1, but its roughly 40 million EU users faced the largest single exposure in the market heading into the deadline. Regulators are also explicitly allowed to weigh an applicant’s history: Binance’s 2023 settlement with US authorities, which included a $4.3 billion penalty, was cited as relevant context for its slower, more contested MiCA path compared to Coinbase or Kraken.
The cost angle here is concrete: MiCA-licensed EU platforms are also capped at low leverage for retail derivatives (as low as 2x under some structures, and a 10x ceiling even for exchanges with additional investment-firm licensing), and MiCA-compliant venues delisted USDT between late 2024 and early 2025 because Tether has not sought e-money-token authorization under the regulation. If your trading strategy depends on USDT pairs or leverage above those caps, the “hidden fee” of regulatory compliance is a forced shift to USDC/EURC and a different product entirely — worth knowing before you fund an account, not after.
In the US, Coinbase’s status as a NASDAQ-listed public company with audited financials remains its primary differentiator for investors prioritizing regulatory transparency over raw fee minimization, while Kraken settled with the SEC in 2025 over its staking program and has since restructured its US offerings to stay compliant while continuing staking in jurisdictions where it remains permitted.
Security track record: the cost you only pay once, but pay in full
Trading fees are a known, bounded cost. Security failure is an unbounded one, and 2025 was the worst year on record for exchange-level losses. On February 21, 2025, North Korea-linked hackers executed the largest cryptocurrency theft in history, stealing approximately $1.46 billion in ETH from a single Bybit cold wallet — not through a stolen private key, but by compromising a third-party transaction-signing interface and manipulating what Bybit’s own employees saw on screen during a routine multisig approval. The FBI attributed the attack to the Lazarus Group within days. Bybit absorbed the loss and covered user funds through a bridge loan and internal reserves, which industry analysts have noted is the key structural difference from the FTX collapse: FTX’s 2022 failure exposed fraud and a hollow balance sheet leading to insolvency, while Bybit’s ability to absorb a $1.46 billion hit and remain solvent suggested top-tier exchanges now hold enough capital depth to survive catastrophic security failures as an operational cost rather than an extinction event.
Bybit’s incident wasn’t isolated. DMM Bitcoin lost roughly $305 million in Bitcoin in May 2024 and ultimately wound down operations by early 2025, transferring customers to SBI VC Trade. WazirX, India’s largest exchange, lost approximately $235 million in July 2024 through a multisig signing-interface exploit with the same attack signature. Industry-wide, security firm SlowMist recorded roughly 200 security incidents in 2025 — about half the prior year’s count — but total losses climbed to roughly $2.9 billion, up from about $2 billion in 2024, because attackers have shifted from many small opportunistic hits to fewer, much larger strikes on high-liquidity centralized targets.
Against that backdrop, the exchanges with the strongest documented security histories stand out by omission: Kraken, operating continuously since 2011, has not suffered a major exchange-level hack, and its proof-of-reserves practice is frequently cited by security researchers as an industry benchmark. Binance maintains a $1 billion SAFU insurance fund and monthly proof-of-reserves attestations, though its scale and profile have also made it a persistent target. The practical lesson for long-term investors, independent of which exchange you use: an exchange’s insurance fund and proof-of-reserves cadence are fee-relevant, because they represent the cost of the tail risk you’re implicitly accepting by keeping assets in custodial storage rather than moving them to self-custody.
Putting it together: the real cost stack
A trade’s true cost is the sum of several layers most fee comparisons show separately or not at all:
- Trading fee — the advertised maker/taker rate, and only accurate if you’re using the advanced/pro interface
- Spread — embedded in simple/instant buy screens, often 0.5%–1.5% and rarely itemized as its own line
- Payment method fee — free via ACH/SEPA, up to 3.99% via debit or credit card
- Withdrawal fee — dependent on which blockchain network you select, not just which asset
- Staking commission — 25–35% of yield on major platforms, invisible in the advertised APY
- Regulatory/product risk — leverage caps, asset delistings, or service suspension tied to licensing status in your jurisdiction
- Tail risk — the uninsured portion of custodial exposure, which security track record and insurance-fund size partially offset
For a full side-by-side ranking of how 12 platforms score across trading fees, liquidity, security, withdrawal speed, and regulatory compliance, see the pillar comparison in the Global Crypto Exchange Cost Map 2026. And for the underlying math on how even a fraction-of-a-percent fee difference compounds over a multi-year holding period, see Crypto Trading Fees Explained: How Exchange Costs Affect Long-Term Investment Returns.